1. Background
In online environment, we have a web application to supply workbench service, and normal business time is from 8:00 AM to 8:00 PM. The web application opens different permissions to different roles by different authority codes. I find the memory usage increase gradually when check the healthy situation of the service. So I suspect preliminarily something caused memory leak. Later, after some investigation, the culprit of memory leak is the authority code.
2. Parse GC log
The first thing for me is to check the online GC log. Obviously, memory leak of JVM is always caused by some object accumulated in Heap that cannot be collected by GC.
2.1. JVM Config
-Xss256k -Xms1024m -Xmx2048m
-XX:MaxMetaspaceSize=256m
-XX:+HeapDumpOnOutOfMemoryError
-XX:HeapDumpPath=$log_dir
-XX:ErrorFile=$log_dir/jvm_err.log
-XX:+UseParNewGC // note here
-XX:+UseConcMarkSweepGC // note here
-XX:ConcGCThreads=$cpu_core
-XX:ParallelGCThreads=$cpu_core
-XX:+ScavengeBeforeFullGC
-XX:+CMSScavengeBeforeRemark
-XX:+CMSParallelRemarkEnabled
-XX:CMSInitiatingOccupancyFraction=70
-XX:+UseGCLogFileRotation
-XX:NumberOfGCLogFiles=5
-XX:GCLogFileSize=50M -verbose:gc
-XX:+PrintHeapAtGC
-XX:+PrintGCDetails
-XX:+PrintGCDateStamps
-XX:+PrintGCTimeStamps
-XX:+PrintGCApplicationStoppedTime
-Xloggc:$log_dir/gc.log
GC strategy of Yong Gen is ParNew enabled by -XX:+UseParNewGC. ParNew is a parallel copy collector, like the Copy collector, but uses multiple threads in parallel and has an internal ‘callback’ that allows an old generation collector to operate on the objects it collects.
GC strategy of Old Gen is ConcurrentMarkSweep enabled by XX:+UseConcMarkSweepGC. The concurrent collector, a garbage collection algorithm that attempts to do most of the garbage collection work in the background without stopping application threads while it works (there are still phases where it has to stop application threads, but these phases are attempted to be kept to a minimum). Note if the concurrent collector fails to keep up with the garbage, it fails over to the serial MarkSweepCompact collector for (just) the next GC.
2.2. Allocation Failure
After review GC log, I see a “allocation failure” from it, so I get figure out what’s going on caused it. By google, there are some expainations about Allocation Failure:
- Previous(older) JVM were not printing GC cause for minor GC cycles.
- “Allocation Failure” means that no more space left in Eden to allocate new object and then JVM prints “Allocation Failure” to GC log as a mark. So, it is normal cause of young GC.
- The string “Failure” is somewhat misleading, the failed allocation will be retried and typically succeeds once the GC finishes.
So next is to verify : 1) whether minor GC is frequent; 2) whether minor GC will take a unreasonal time. Below, there is a GC report will give some advices.
2.3. Parse GC report
Thanks to https://fastthread.io/
We can get some conclusions from above reports:
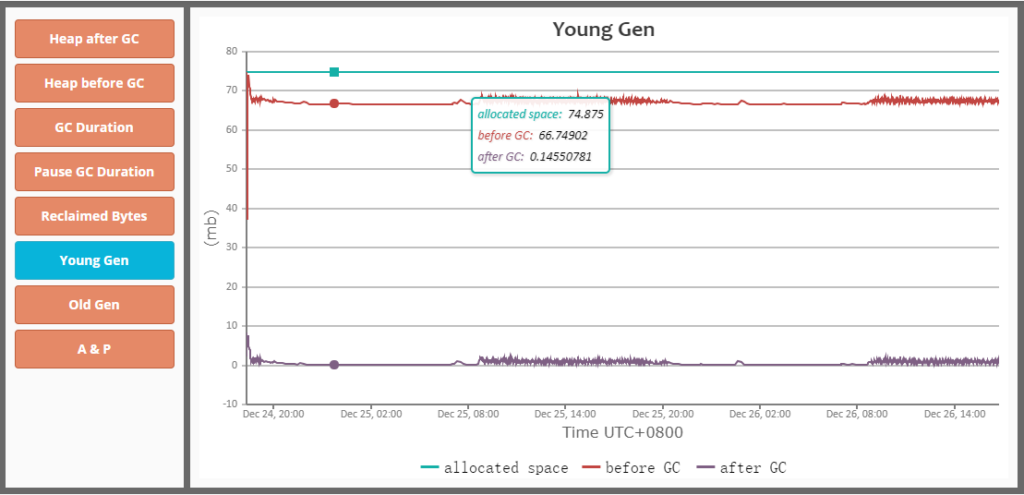
- there is nothing unnormal about the minor GC
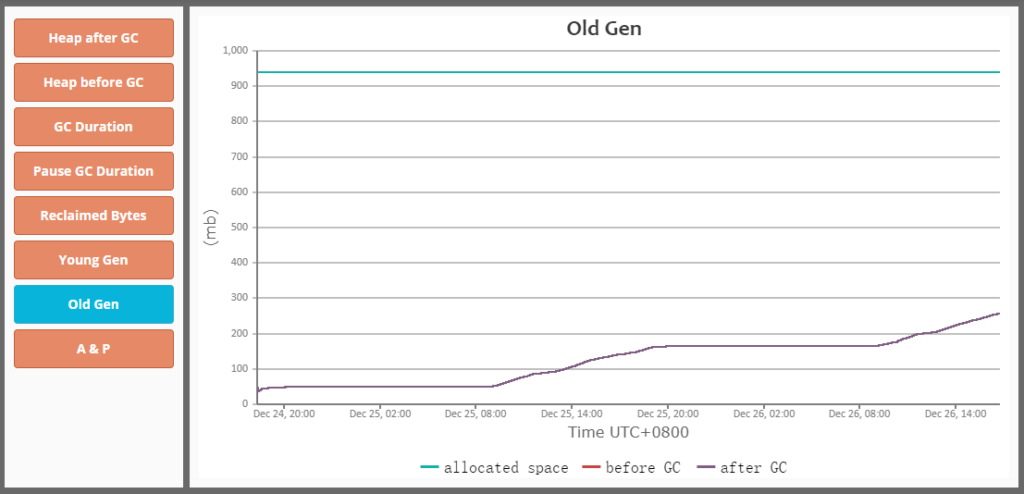
- the memory usage of Old Gen increases gradually as time goes on, that means some objects are promoted from Yong Gen to Old Gen constantly during some time
- the period of increasing space of Old Gen is the time of business time, from 8:00 AM to 8:00 PM, it is possible that the business operation caused the memory usage of Old Gen increasing
- the memory usage increase smoothly, not violent or irregular, that can exclude the possibility of creating too many big objects
Next, I get find why the web application create a lot of new objects constantly and JVM promote them from Yong Gen to Old Gen smoothly during the business time. But obviously, only the GC reports is not enough.
3. Parse Heap Dump
Firstly, I need generate JVM heap dump from online web application. There are several ways can help you achieve this(jmap, jcmp, jstack etc). And then what you need do is parsing the heap dump by some tools. Here I choose parsing tool is Memory Analyzer Tool of Eclipse, it’s an open source.
The result of importing heap dump into MAT as following illustration:
BTW: Usually, if the space retained by a object grow gradually and cannot collected in time, essentially, the space was captured by abundant numbers or strings. E.g., if you used to send message by Kafka, you may know that the messages will be cached untill reaching a specified size before sent, the cached data, usually, is bunch of chars.
Shallow Heap size : the space used by the object itself essentially.
Retained Heap size : the space used by the object itself and the direct or indirect referenced objects
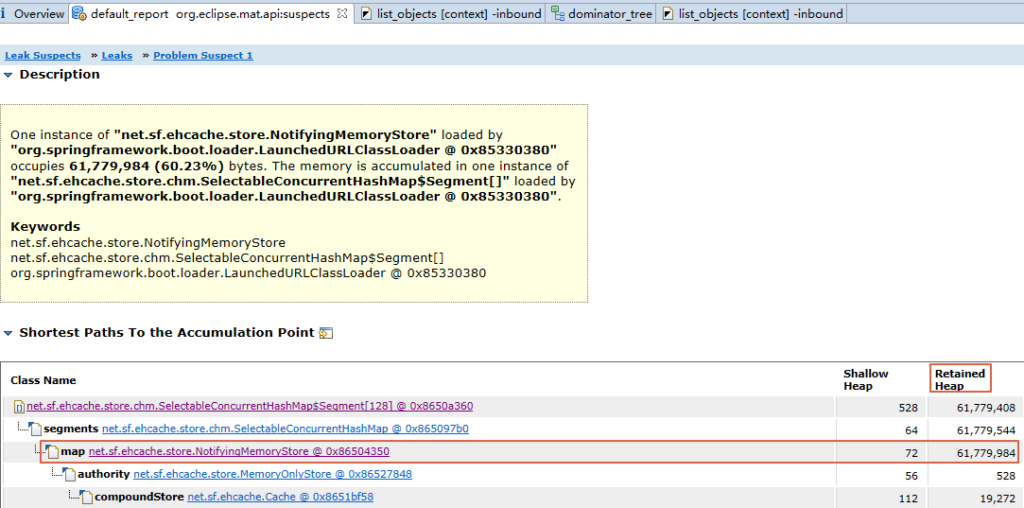
From the Leak Suspects of above illustration, there is a biggest object occupies 60.23% JVM heap size. Next, I will parse the biggest object step by step to check what kind objects are referenced constantly.
3.1 Incoming References
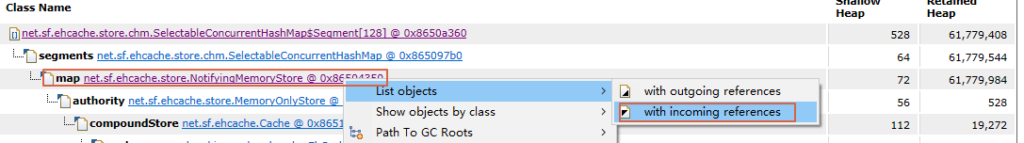
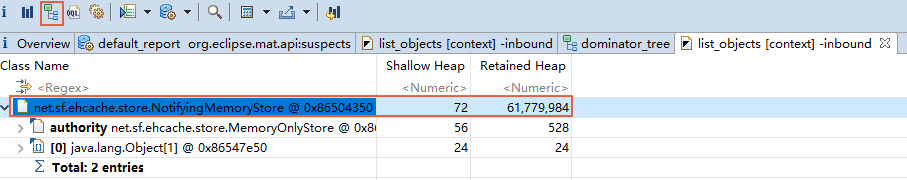
From above screenshots, we can deduce that the biggest object is a cached object, and the size of retained space(Old Gen) increase constantly and smoothly.
3.2. Dominator Tree
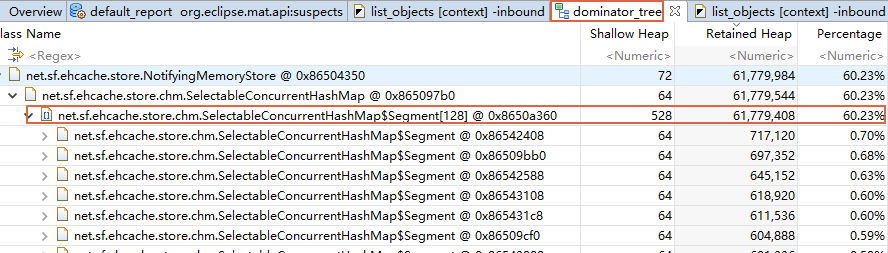
From the Dominator Tree, the cached object references a large number of “SelectableConcunrrentHashMap” objects, and the retained JVM Head reach 60.23%.
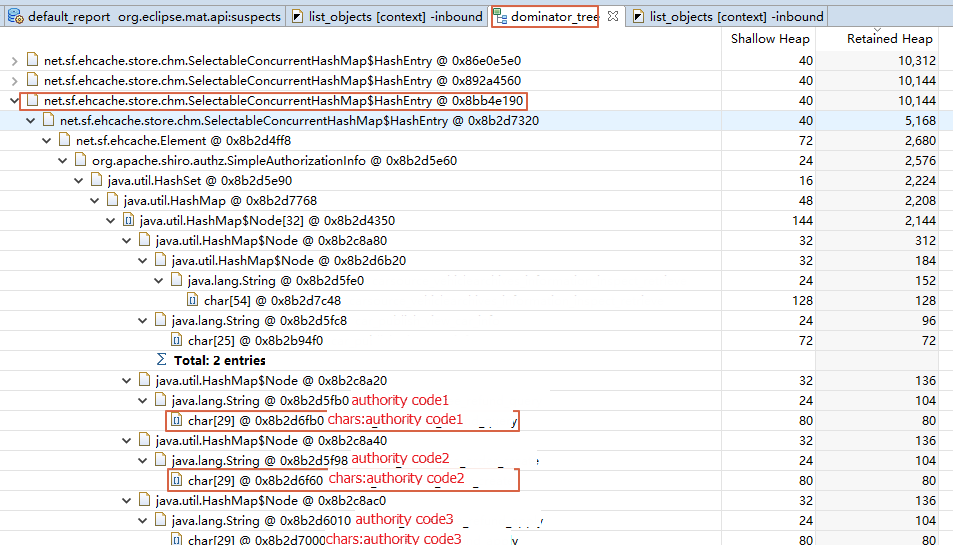
From this screenshot, I find abundant authority codes are cached in JVM Heap. Obviously, it’s a bug of business code.
Authority code is our business term used to authorize different role.
3.3. Conclusion
By the above analysis, the conclusion is that it’s a memory leak from JVM Old Gen caused by company’s auth component. In our business, some interfaces are protected by different authority codes, if a business person want access a specfied interface, a relevant authority code have to be taken. The problem is the authority codes are always cached by the component for every accessing of business persons during business time.
Oh my goodness! Incredible article dude! Thank you so much, However
I am having difficulties with your RSS. I don’t know the reason why I cannot subscribe to
it. Is there anybody else getting similar RSS issues?
Anybody who knows the solution can you kindly respond?
Thanks!!
I enjoy reading an article that can make people think. Also, thanks
for allowing me to comment!
Does your site have a contact page? I’m having a
tough time locating it but, I’d like to shoot you an email.
I’ve got some ideas for your blog you might be
interested in hearing. Either way, great site and I look
forward to seeing it improve over time.
For me , the blog just records some experiences of my problem solving, so, currently it’s no contact page, but I will think about it. My email: q_fen@foxmail.com, but I cannot promise the reply is timely.
I am sure this piece of writing has touched all the internet
viewers, its really really fastidious paragraph on building up new blog.
Good day! I just wish to offer you a huge thumbs up for the great information you have got
right here on this post. I’ll be coming back to your web site for more
soon.
Attractive section of content. I just stumbled upon your blog and in accession capital to assert that I get
actually enjoyed account your blog posts. Any way
I’ll be subscribing to your augment and even I
achievement you access consistently fast.